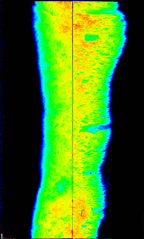
To visualize and quantify multiphase flow/transport processes occurring in heterogeneous, opaque, systems (i.e., rock slabs, natural soils, opaque fields) a unique, high resolution, x-ray absorption imaging system was developed (Tidwell and Glass, 1994). With this technique, liquid saturation, solute concentration, and/or porosity integrated over the media’s thickness are measured as variations in the transmitted x-ray intensity field. These variations are directly related to the intensity of x-ray absorption that, in turn, is related to the fluid saturation, solute concentration, or porosity at any given point in the image domain.
X-ray images were acquired by directing a beam of x-rays at the face of the test media while recording the transmitted intensity field on film secured behind the test chamber. The exposed film was developed and them placed in front of a diffused bank of high-frequency (60 MHz), high-output, fluorescent lights for digital imaging. These techniques were developed prior to the development of cost effective, direct-to-digital acquisition techniques which are commonly seen today.
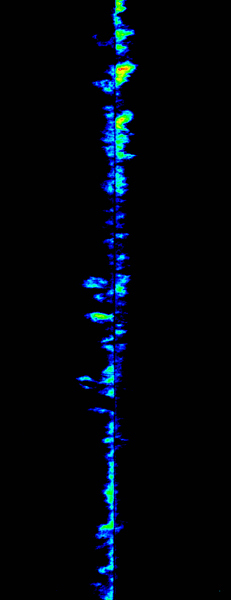
Variation in the transmitted light intensity field were recorded by means of a CCD (charge-coupled device) camera focused on the front of the film. Depending on the camera the film was either digtized to a resolution of 1024×1024 or 2048×2048 points, with each point assigned a gray level between zero and 4095 (12-bits) according to the transmitted light intensity. The array size of the camera and the size of the test system determine the spatial resolution of the acquired image. Images shown below were analyzed at a spatial resolution of 0.4×0.4 millimeters.
To achieve high image contrast with respect to the measured state variable, the use of a contrast enhancing agent was generally required. The iodine ion, added in the form of potassium iodide (KI), was used as it is geochemically conservative and possesses favorable x-ray absorption characteristics. The KI can be used to dope the aqueous phase in multiphase flow experiments or used as a tracer in contaminant transport experiments. The digitized gray level values were converted to water saturation through a two-step process. The first step adjusted the image according to a constant density wedge included in each image to correct for variations in the source intensity and variations in film quality. In the second step the adjusted gray level values were converted to saturation through application of linear absorption theory (Tidwell and Glass, 1994). As an independent check the total mass as estimated from the x-ray image was consistently compared to the mass balance calculated from the inflow and outflow data. In this way, the acquired images were not merely qualitative images of the transport process; rather, quantitative data on the full 2-D solute concentration field.